4.3. Selecting Features
So far we have been using WMS to render raster images and overlay them in OpenLayers. We can also pull features as vectors and draw them on top of a base map. One of the advantages of serving vector data is that users can interact with the data. In this example, we create a vector layer where users can select and view feature information.
4.3.1. Create a Vector Layer and a SelectFeature Control
Tasks
Let’s start with the working example from the previous section. Open
map.htmlin your text editor and make sure it looks something like the following:<!DOCTYPE html> <html> <head> <title>My Map</title> <link rel="stylesheet" href="openlayers/theme/default/style.css" type="text/css"> <style> #map-id { width: 512px; height: 256px; } #scaleline-id { margin: 10px; font-size: xx-small; } </style> <script src="openlayers/lib/OpenLayers.js"></script> </head> <body> <h1>My Map</h1> <div id="map-id"></div> <div id="scaleline-id"></div> <script> var nyc = new OpenLayers.Bounds( -74.032, 40.685, -73.902, 40.876 ); var map = new OpenLayers.Map("map-id", { projection: new OpenLayers.Projection("EPSG:4326"), maxExtent: nyc, restrictedExtent: nyc, maxResolution: 0.0005, numZoomLevels: 5 }); var base = new OpenLayers.Layer.WMS( "New York City", "/geoserver/wms", {layers: "tiger-ny"} ); map.addLayer(base); var center = new OpenLayers.LonLat( -73.987, 40.737); map.setCenter(center,3); var scaleline = new OpenLayers.Control.ScaleLine({ div: document.getElementById("scaleline-id") }); map.addControl(scaleline); </script> </body> </html>
Next add a vector layer that requests the most important places of New York City. Because this data will be rendered client-side (i.e., by your browser), users can interact with its features. Somewhere in your map initialization (after the
mapobject is created), add the following code to create a vector layer that uses the WFS protocol:var landmarks = new OpenLayers.Layer.Vector("NY Landmarks", { strategies: [new OpenLayers.Strategy.BBOX()], protocol: new OpenLayers.Protocol.WFS({ version: "1.1.0", url: "/geoserver/wfs", featureType: "poly_landmarks", featureNS: "http://www.census.gov", srsName: "EPSG:4326" }), filter: new OpenLayers.Filter.Comparison({ type: OpenLayers.Filter.Comparison.LIKE, property: "CFCC", value: "D*" }) }); map.addLayer(landmarks);
Note
Because we don’t want all the features of the layer, we add to the layer constructor a new element, a filter. A filter is an object that declares some conditions over the data. OpenLayers add this condition to the requests to the server using the proper language depending on the protocol, if supported. In this case it will add to the BBOX strategy the necessary GML tags so GeoServer just answers with the features where the field CFCC has a value that starts with a capital D. The complete WFS request data (bounding box and filter) looks like this:
<wfs:GetFeature
  xmlns:wfs="http://www.opengis.net/wfs" service="WFS" version="1.1.0"
  xsi:schemaLocation="http://www.opengis.net/wfs http://schemas.opengis.net/wfs/1.1.0/wfs.xsd"
  xmlns:xsi="http://www.w3.org/2001/XMLSchema-instance">
  <wfs:Query typeName="feature:poly_landmarks" srsName="EPSG:4326"
    xmlns:feature="http://www.census.gov">
    <ogc:Filter xmlns:ogc="http://www.opengis.net/ogc">
      <ogc:And>
        <ogc:PropertyIsLike wildCard="*" singleChar="." escapeChar="!">
          <ogc:PropertyName>CFCC</ogc:PropertyName>
          <ogc:Literal>D*</ogc:Literal>
        </ogc:PropertyIsLike>
        <ogc:BBOX>
          <gml:Envelope xmlns:gml="http://www.opengis.net/gml" srsName="EPSG:4326">
            <gml:lowerCorner>-74.019 40.721</gml:lowerCorner>
            <gml:upperCorner>-73.955 40.753</gml:upperCorner>
          </gml:Envelope>
        </ogc:BBOX>
      </ogc:And>
    </ogc:Filter>
  </wfs:Query>
</wfs:GetFeature>
With the
landmarkslayer requesting and rendering features, we can create a control that allows users to select them. In your map initialization code, add the following after the creation of yourbuildingslayer:var select = new OpenLayers.Control.SelectFeature([landmarks]); map.addControl(select); select.activate();
Save your changes to
map.htmland open the page in your browser: http://localhost:8082/ol_workshop/map.html. To see feature selection in action, use the mouse-click to select a building: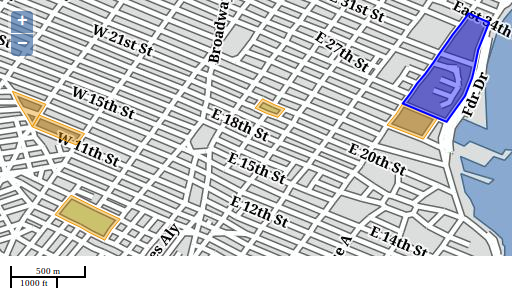
Using a control to select features from a vector layer.
4.3.2. Displaying Building Information on Feature Selection
Note
This section will complete the bonus exercise proposed on your first approach to OpenLayers vector data.
We can use layer events to respond to feature selection. This is useful for displaying specific feature information to the user. The featureselected event is triggered on a vector layer each time a feature is selected. Here we add a listener for this event that will display feature information below the map.
Tasks
First we need to add an element to display the feature information. Open
map.htmlin your text editor and insert the following markup into the<body>of your page.<div id="output-id"></div>
Next we add some style declarations so that the feature information output doesn’t sit on top of the scale bar. Give your output element some margin, by adding the following within the
<style>element:#output-id { margin: 10px 220px; }Finally, we create a listener for the
featureselectedevent that will display feature information in the output element. Insert the following in your map initialization code after the creation of thelandmarkslayer:landmarks.events.on({ featureselected: function(event) { var feature = event.feature; var id = feature.attributes.CFCC; var area = feature.geometry.getGeodesicArea(); var output = feature.attributes.LANAME + " (" + id + ")" + " Area: " + area.toFixed(0) +" m2"; document.getElementById("output-id").innerHTML = output; } });
Note
See how we get the area from the
geometryobject. As we are dealing with geographic coordinates, OpenLayers provide agetGeodesicArea. When we work with projected coordinates we should use instead thegetAreamethod.Save your changes and refresh the
map.htmlpage in your browser: http://localhost:8082/ol_workshop/map.html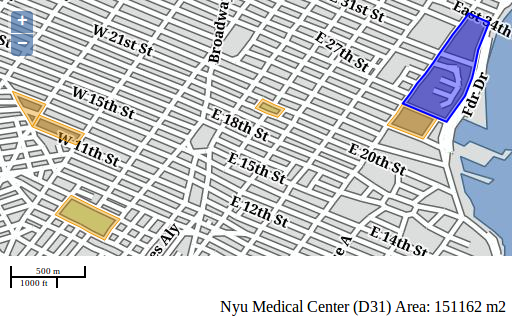
Displaying building information on feature selection.
Hint
Take some time and use the Chrome developer tools to put a breakpoint on this function and inspect the
eventobject that wraps the feature selected.